 Image 1 of 1
Tracking your Faire performance shouldn’t take hours every month.
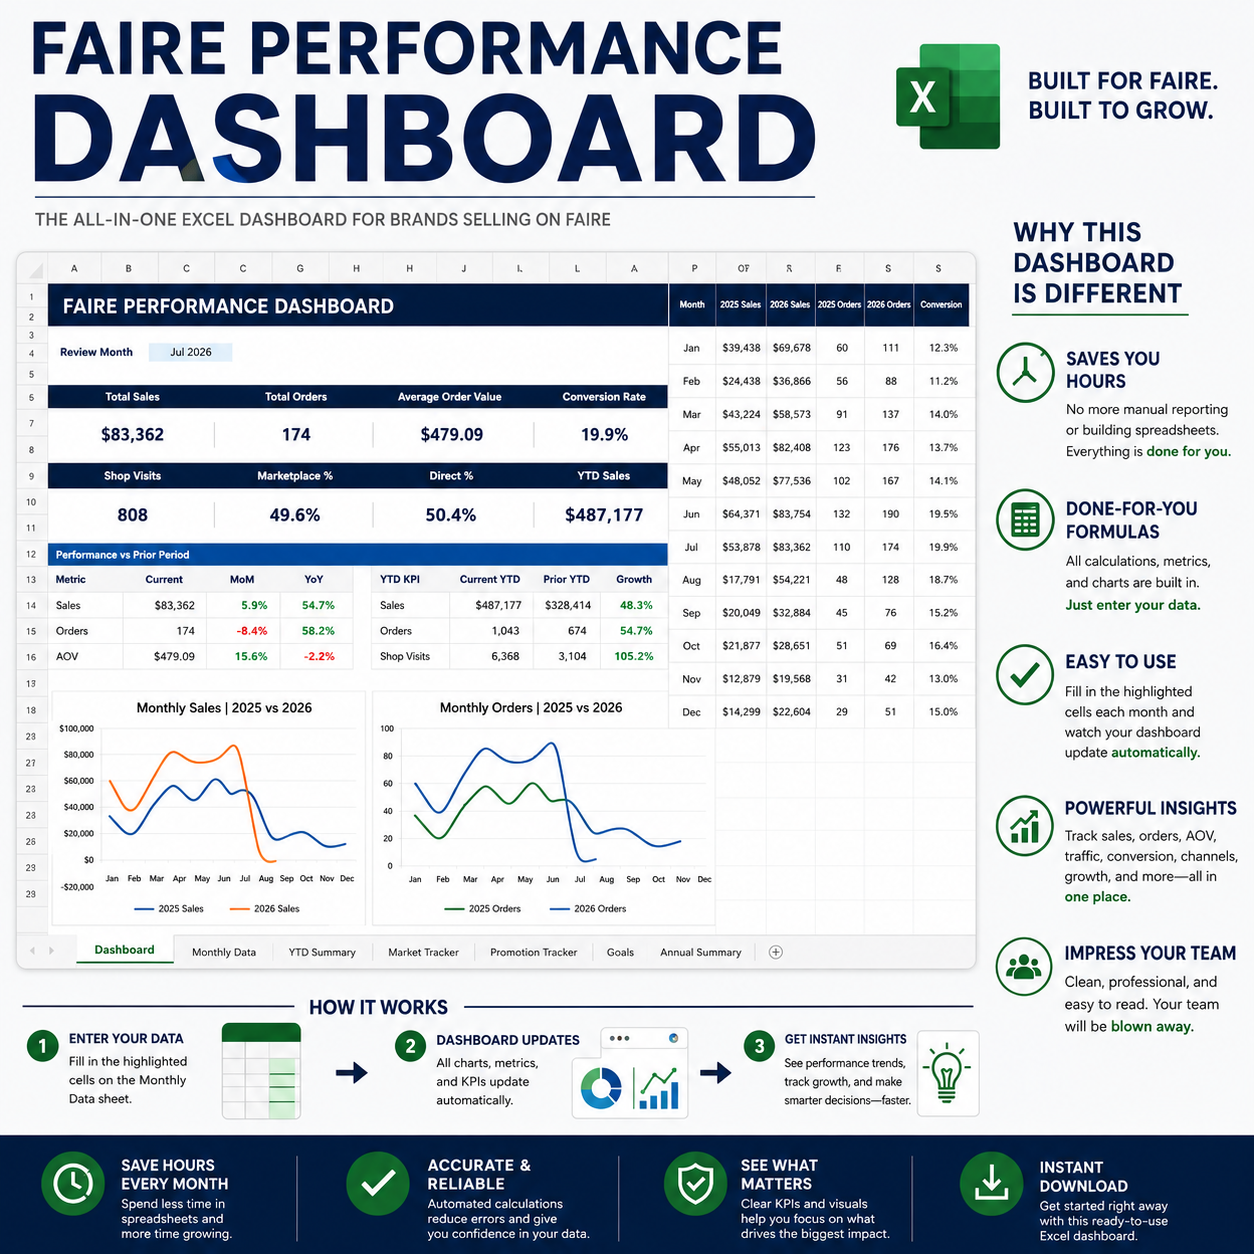
The Faire Performance Dashboard is a professionally designed Excel dashboard built specifically for wholesale brands selling on Faire. Simply enter your monthly data into the highlighted fields, and watch your dashboard come to life with automatic calculations, charts, and performance insights.
No more building spreadsheets. No more creating formulas. No more wondering if your business is actually growing.
Everything has already been done for you.
✔ Saves hours of reporting every month
✔ Built specifically for brands selling on Faire
✔ Done-for-you formulas and calculations
✔ No complicated setup or Excel expertise required
✔ Simply enter your monthly numbers into the highlighted cells
✔ Watch your dashboard automatically come to life with professional charts, KPIs, and growth insights
✔ Designed with an executive-level look and feel that’s easy to read and understand
✔ Impress your team, business partners, or leadership with a polished dashboard that looks like it came from a premium analytics platform—not a spreadsheet
Whether you’re reviewing performance by yourself or presenting results in a meeting, your team will immediately understand what’s working, what needs attention, and where the biggest opportunities are.
Instead of manually comparing reports and calculating performance metrics, this dashboard automatically tracks your key business KPIs so you can spend more time growing your business and less time working in spreadsheets.
Simply fill in the highlighted input fields each month, and the dashboard instantly updates with professional charts, growth metrics, and trend analysis.
Interactive executive dashboard
Done-for-you formulas—no Excel expertise required
Easy monthly data entry using highlighted input fields
Automatic Month-over-Month (MoM) reporting
Automatic Year-over-Year (YoY) reporting
Year-to-Date (YTD) sales tracking
Total Sales, Orders & Average Order Value (AOV)
Marketplace vs. Direct sales analysis
Shop Visits & Conversion Rate tracking
Faire Market performance tracker
Promotion performance tracker
Annual goal tracking
Automatic charts and visual KPI dashboards
Brands selling on Faire
Gift, boutique, apparel, home, beauty, and lifestyle brands
Wholesale businesses that want to make data-driven decisions
Founders, sales managers, and wholesale teams looking to save time while gaining better visibility into performance
High-performing brands don’t just look at sales—they understand why sales are changing.
This dashboard gives you an instant snapshot of your business by tracking traffic, conversion, average order value, sales channels, and growth trends—all in one place. Instead of spending hours pulling reports together, you’ll have a polished, executive-level dashboard that updates itself as you enter new data.
The clean design makes it incredibly easy to understand at a glance, so whether you’re reviewing results on your own or sharing them with your team, everyone can quickly see what’s driving growth and where to focus next.
Spend less time building spreadsheets and more time growing your wholesale business.
Instant Digital Download • Microsoft Excel Compatible
Tracking your Faire performance shouldn’t take hours every month.
The Faire Performance Dashboard is a professionally designed Excel dashboard built specifically for wholesale brands selling on Faire. Simply enter your monthly data into the highlighted fields, and watch your dashboard come to life with automatic calculations, charts, and performance insights.
No more building spreadsheets. No more creating formulas. No more wondering if your business is actually growing.
Everything has already been done for you.
✔ Saves hours of reporting every month
✔ Built specifically for brands selling on Faire
✔ Done-for-you formulas and calculations
✔ No complicated setup or Excel expertise required
✔ Simply enter your monthly numbers into the highlighted cells
✔ Watch your dashboard automatically come to life with professional charts, KPIs, and growth insights
✔ Designed with an executive-level look and feel that’s easy to read and understand
✔ Impress your team, business partners, or leadership with a polished dashboard that looks like it came from a premium analytics platform—not a spreadsheet
Whether you’re reviewing performance by yourself or presenting results in a meeting, your team will immediately understand what’s working, what needs attention, and where the biggest opportunities are.
Instead of manually comparing reports and calculating performance metrics, this dashboard automatically tracks your key business KPIs so you can spend more time growing your business and less time working in spreadsheets.
Simply fill in the highlighted input fields each month, and the dashboard instantly updates with professional charts, growth metrics, and trend analysis.
Interactive executive dashboard
Done-for-you formulas—no Excel expertise required
Easy monthly data entry using highlighted input fields
Automatic Month-over-Month (MoM) reporting
Automatic Year-over-Year (YoY) reporting
Year-to-Date (YTD) sales tracking
Total Sales, Orders & Average Order Value (AOV)
Marketplace vs. Direct sales analysis
Shop Visits & Conversion Rate tracking
Faire Market performance tracker
Promotion performance tracker
Annual goal tracking
Automatic charts and visual KPI dashboards
Brands selling on Faire
Gift, boutique, apparel, home, beauty, and lifestyle brands
Wholesale businesses that want to make data-driven decisions
Founders, sales managers, and wholesale teams looking to save time while gaining better visibility into performance
High-performing brands don’t just look at sales—they understand why sales are changing.
This dashboard gives you an instant snapshot of your business by tracking traffic, conversion, average order value, sales channels, and growth trends—all in one place. Instead of spending hours pulling reports together, you’ll have a polished, executive-level dashboard that updates itself as you enter new data.
The clean design makes it incredibly easy to understand at a glance, so whether you’re reviewing results on your own or sharing them with your team, everyone can quickly see what’s driving growth and where to focus next.
Spend less time building spreadsheets and more time growing your wholesale business.
Instant Digital Download • Microsoft Excel Compatible